CloudWatch
CloudWatch
- It is a serverless performance monitoring service
Metrics
CloudWatch provides metrics for every services in AWS
Metric is a variable to monitor (CPUUtilization, NetworkIn, …)
Segregated by namespaces (namespace - which AWS service they monitor)
Dimension is an attribute of a metric (instance id, environment, etc.)
Up to 30 dimensions per metric
Metrics have timestamps
Can create CloudWatch dashboards of metrics
Can create CloudWatch Custom Metrics (for the RAM for example)
Custom Metrics
Define and send your own custom metrics to CloudWatch using PutMetricData API
Metric resolution (StorageResolution API) - frequency of sending metric data
Standard: 60 seconds
High Resolution: 1/5/10/30 seconds (higher cost)
Accepts metric data points two weeks in the past and two hours in the future
Metric Streams
Continually stream CloudWatch metrics to a destination of your choice, with near-real-time delivery and low latency.
Amazon Kinesis Data Firehose (and then its destinations)
3rd party service provider: Datadog, Dynatrace, New Relic, Splunk, Sumo Logic…
Option to filter metrics to only stream a subset of them

Dashboards
Setup custom dashboards for quick access to key metrics and alarms
Dashboards are global (allows to monitor services across accounts & regions)
Dashboards can be shared with people who don’t have an AWS account (public, email address, 3rd party SSO provider through Cognito)
CloudWatch Logs
CloudWatch Logs use to store application logs
Logs Groups: usually represents an application
Log Streams: log instances within application or log files or containers (comes under log groups)
Logs Expiration: never expire (default), 1 days to 10 years.
CloudWatch Logs can send logs to:
Amazon S3 (exports)
Kinesis Data Streams
Kinesis Data Firehose
AWS Lambda
OpenSearch
Logs are encrypted by default (can use KMS-based encryption with own keys)
CloudWatch Logs - Sources
Meaning which services can send its logs into CloudWatch Logs
SDK, CloudWatch Logs Agent, CloudWatch Unified Agent
Elastic Beanstalk: collection of logs from application
ECS: collection from containers
AWS Lambda: collection from function logs
VPC Flow Logs: VPC specific logs
API Gateway
CloudTrail based on filter
Route53: Log DNS queries
CloudWatch Logs Insights
Search and analyze the log data stored in CloudWatch Logs
Example:
find a specific IP in the logs
count occurrences of “ERROR” in the logs
Provides a purpose-built query language - we can create queries (just like SQL) to search inside the CloudWatch Logs
Can save queries and add them to CloudWatch Dashboards
Can query multiple Log Groups in different AWS accounts
It’s a query engine, not a real-time engine (can only query historical data)
CloudWatch Metric Filters
Metric Filters can be used to filter expressions and use the count to trigger CloudWatch alarms.
They apply only on the incoming metrics after the metric filter was created.
Example filters:
find a specific IP in the logs
count occurrences of “ERROR” in the logs
CloudWatch Logs – S3 Export
Log data can take up to 12 hours to become available for export to S3
The API call is CreateExportTask
It is not a near-real-time or real-time
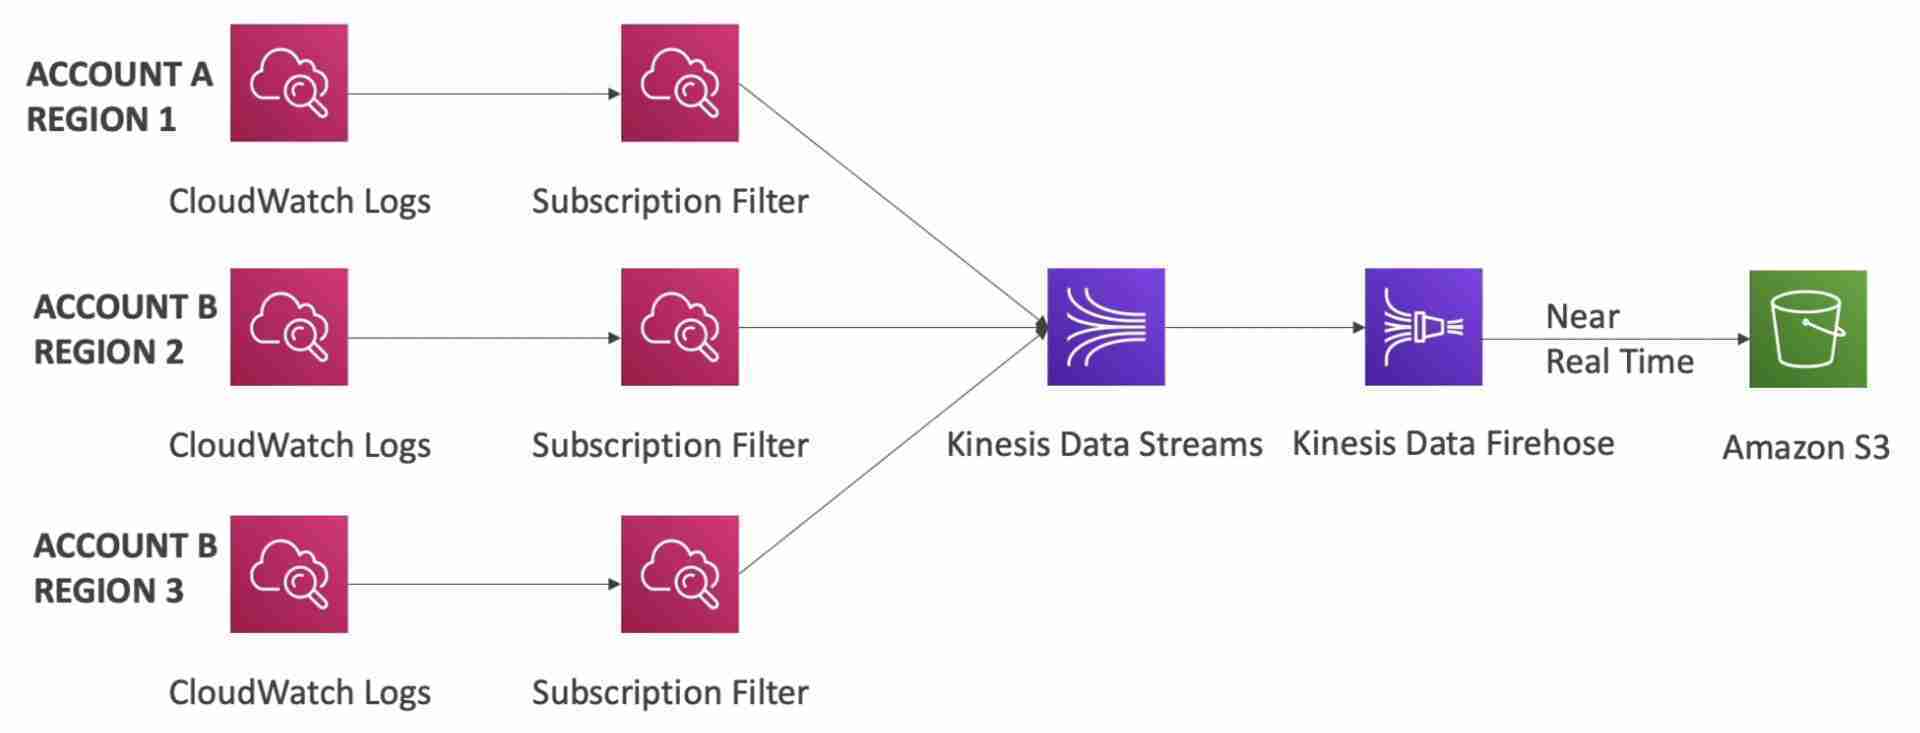
To store logs in real time in S3, use a subscription filter to publish logs to Kinesis Data Firehose in real time which will then write the logs to S3.
CloudWatch Logs Subscriptions
To stream logs in real-time, apply a Subscription Filter on logs
Send to Kinesis Data Streams, Kinesis Data Firehose, or Lambda
Subscription Filter – filter which logs are need to delivered to the destination (2 subscription filter per log group)

CloudWatch Logs Aggregation Multi-Account & Multi Region
Logs from multiple accounts and regions can be aggregated using subscription filters

CloudWatch Logs for EC2
By default, no logs from the EC2 machine will go to CloudWatch
You need to run a CloudWatch agent on EC2 to push the system metrics and logs
Instance role (IAM) must allow the instance to push logs to CloudWatch.
EC2 instances have metrics every 5 minutes
With detailed monitoring (for a cost), you get metrics every 1 minute
The CloudWatch log agent can be setup on-premises too
CloudWatch Logs Agent & Unified Agent
Both are for virtual servers (EC2 instances, on-premise servers)
CloudWatch Logs Agent
Old version of the agent
Can only send logs to CloudWatch Logs
CloudWatch Unified Agent
Can collect additional system-level metrics (RAM, processes)
Can also send logs to CloudWatch Logs
Can be configured using centralized configuration using SSM Parameter Store
CloudWatch Unified Agent – Metrics
CPU (active, guest, idle, system, user, steal)
Disk metrics (free, used, total), Disk IO (writes, reads, bytes, iops)
RAM (free, inactive, used, total, cached)
Netstat (number of TCP and UDP connections, net packets, bytes)
Processes (total, dead, bloqued, idle, running, sleep)
Swap Space (free, used, used %)
CloudWatch Alarms
Alarms are used to trigger notifications for any CW metrics
Alarms can be created based on CloudWatch Logs Metrics Filters

Various options to trigger alarm (sampling, %, max, min, etc.)
An alarm monitors a single CW metric
Alarm States:
OK
INSUFFICIENT_DATA
ALARM
Period:
Length of time in seconds to evaluate the metric before triggering the alarm
High resolution custom metrics: 10 sec, 30 sec or multiples of 60 sec
To test alarms and notifications, set the alarm state to Alarm using CLI
aws cloudwatch set-alarm-state --alarm-name "myalarm" --state-value ALARM --state-reason "testing purposes"
CloudWatch Alarm Targets
EC2 - Stop, Terminate, Reboot, or Recover an EC2 Instance
EC2 Auto Scaling - Trigger Auto Scaling Action (ASG)
SNS - Send notification to SNS
CloudWatch Alarms – Composite Alarms
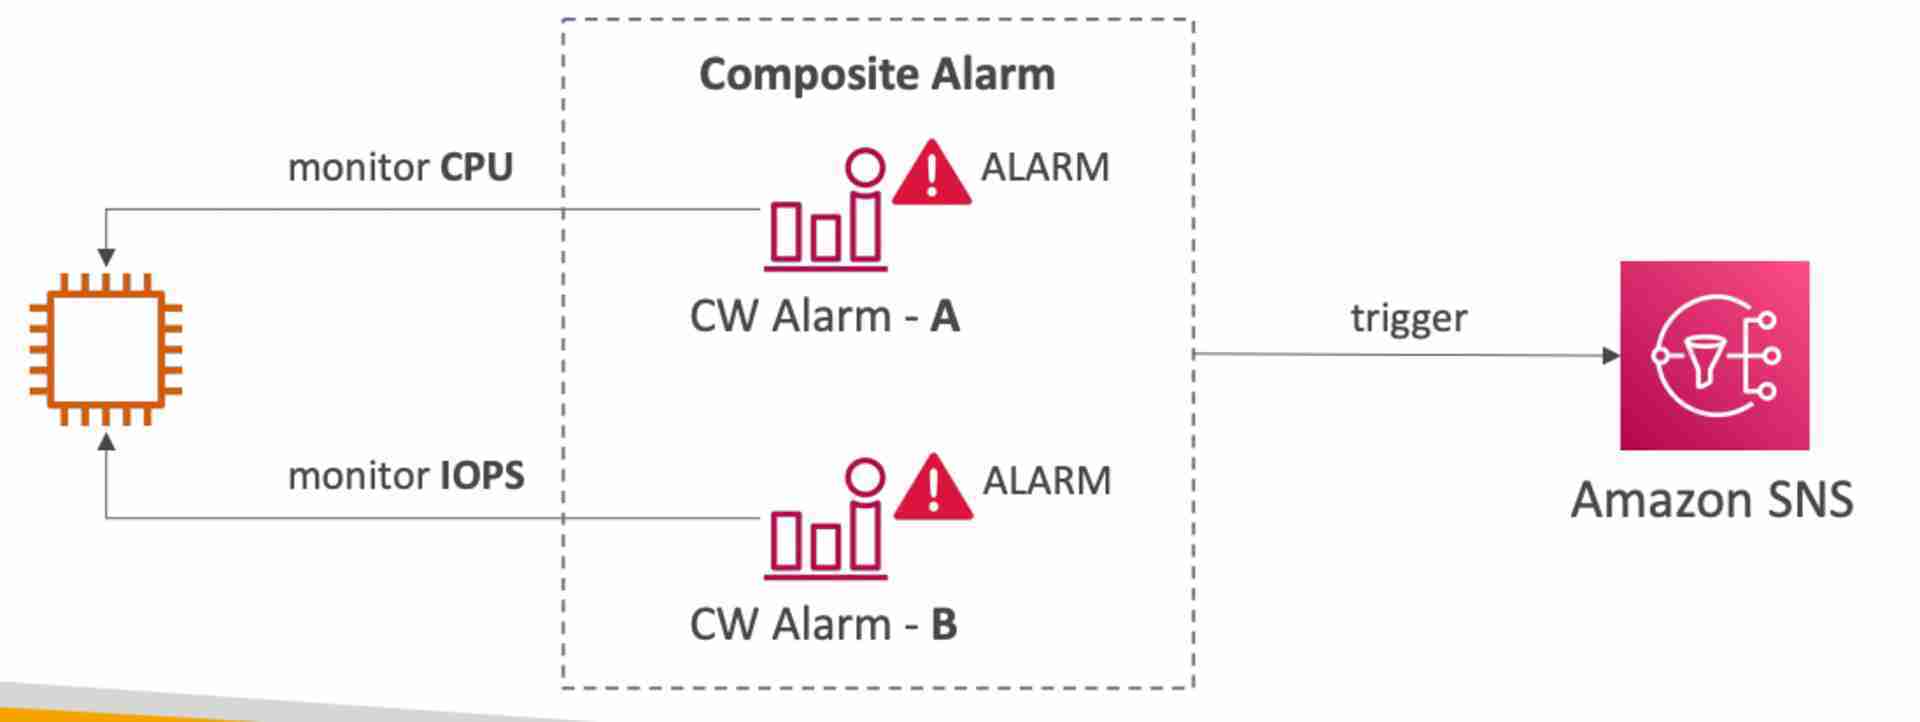
CloudWatch Alarms monitors a single CloudWatch metric
Composite Alarms monitors the states of multiple other alarms using AND and OR conditions to generate a new alarm
This is helpful to reduce alarm noise by creating complex composite alarms.

EC2 Instance Recovery
Status Check:
Instance status = check the EC2 VM
System status = check the underlying hardware
Attached EBS status = check attached EBS volumes
CloudWatch alarm to automatically recover an EC2 instance if it becomes impaired
Terminated instances cannot be recovered
After the recovery, the following are retained
Placement Group
Public IP
Private IP
Elastic IP
Instance ID
Instance metadata
After the recovery, RAM contents are lost

CloudWatch Insights and Operational Visibility
CloudWatch Container Insights
Generates metrics and logs for ECS, EKS, Kubernetes on EC2, Fargate
Needs CloudWatch agent for Kubernetes
CloudWatch Lambda Insights
- Detailed metrics to troubleshoot serverless applications
CloudWatch Contributors Insights
- Find “Top-N” Contributors through CloudWatch Logs
CloudWatch Application Insights
- Automatic dashboard to troubleshoot your application and related AWS services